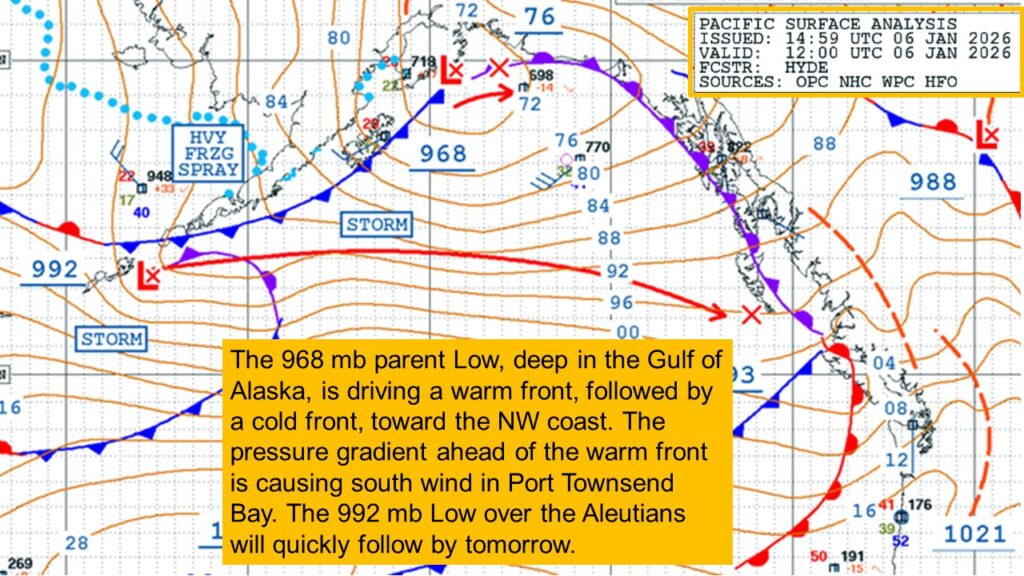
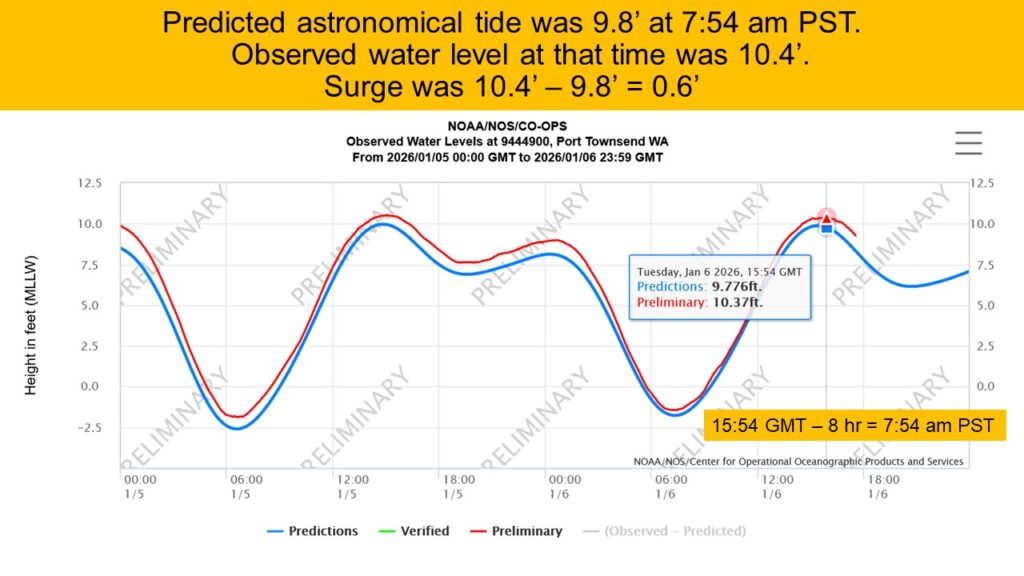
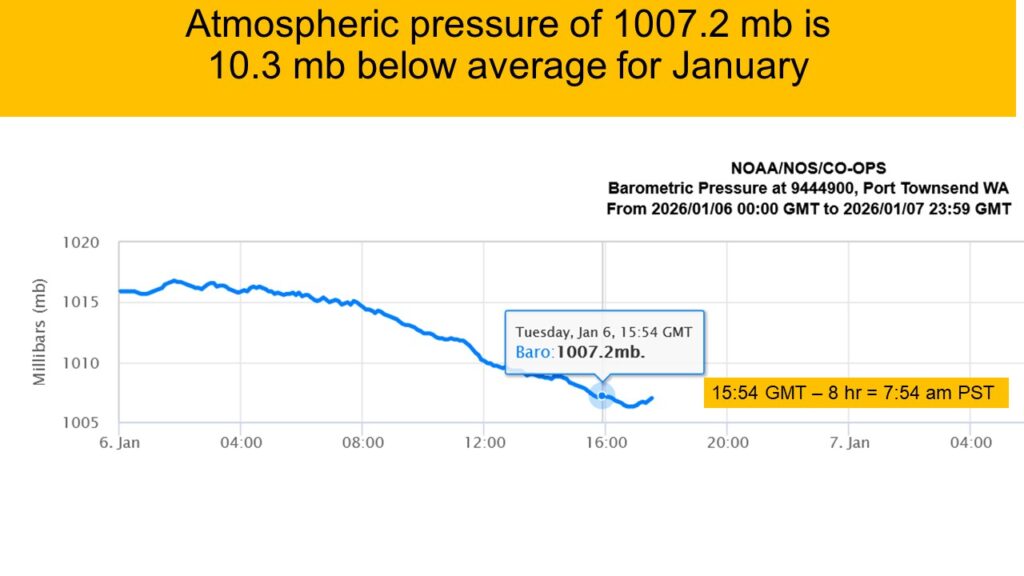
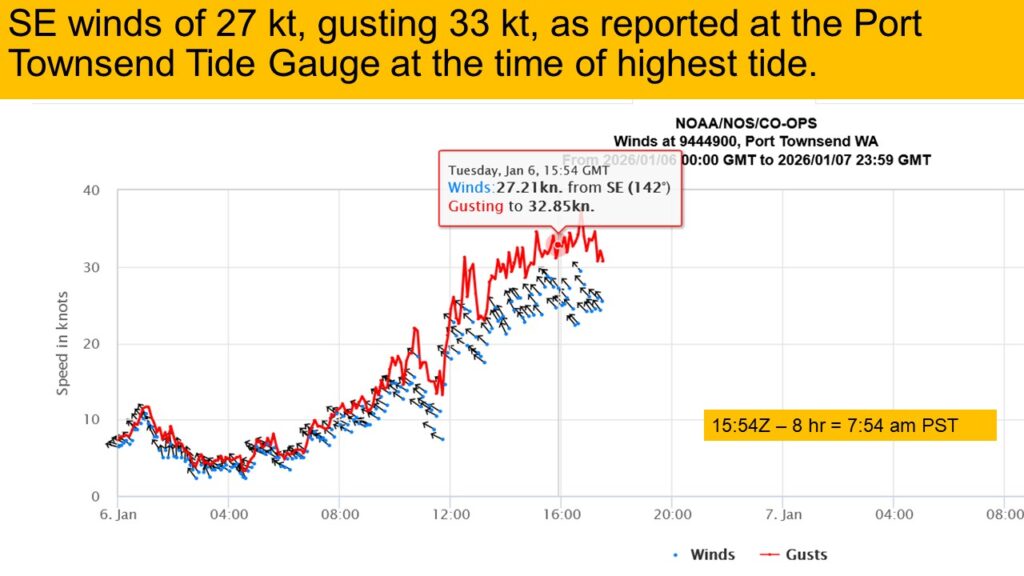
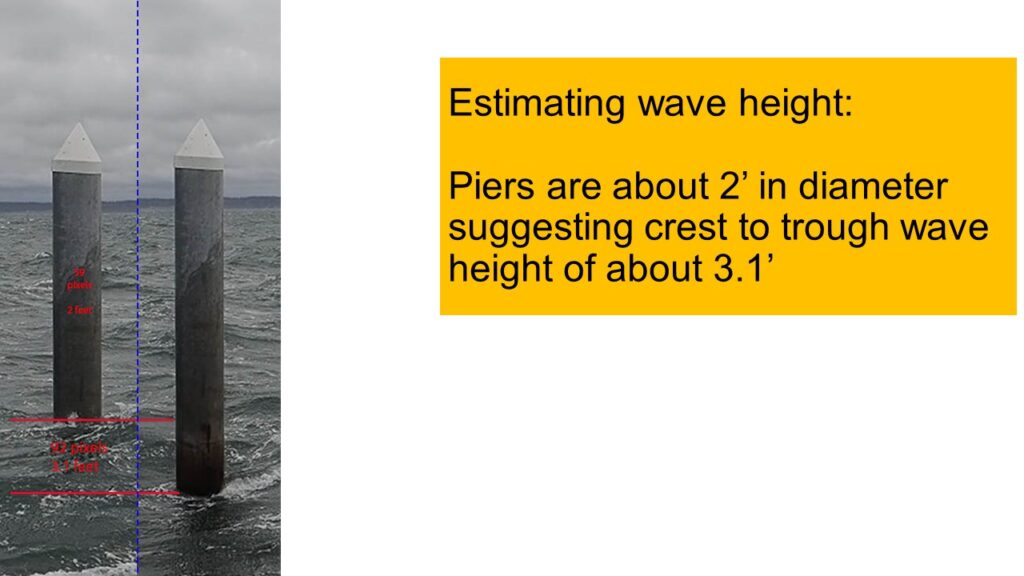
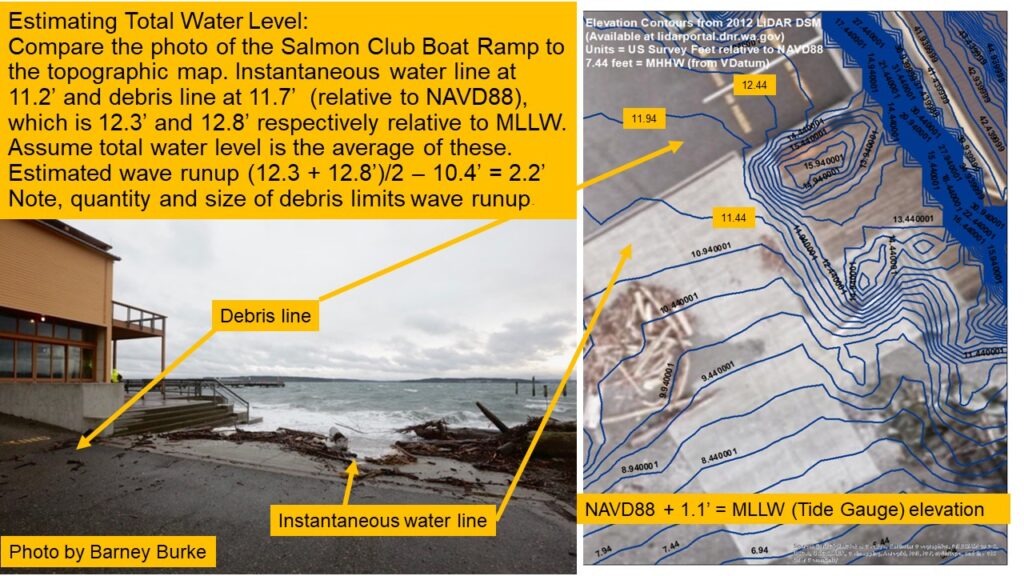
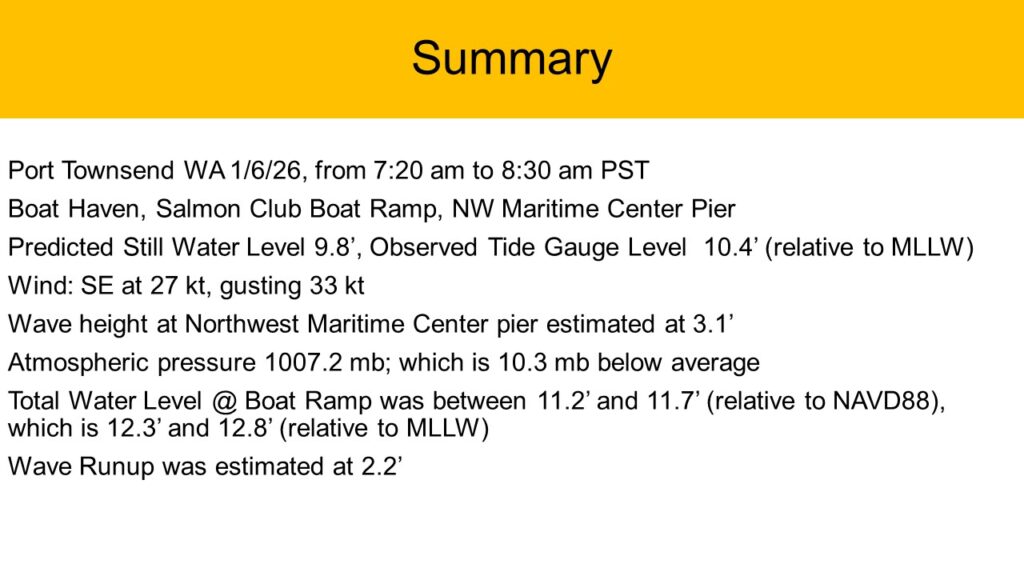
There was a higher than average predicted tide on January 6th, along with SE winds of 27 knots, resulting in an observed tide gauge level of 10.4′, along with wave runup of 2.2′ (the third highest wave runup we have seen since the Local 20/20 king tide team started measuring wave run up in 2018.)
You can learn more about the project in this post. The photos from the project are shared on the MyCoast website (you can zoom in on the map to find the Port Townsend photos.)
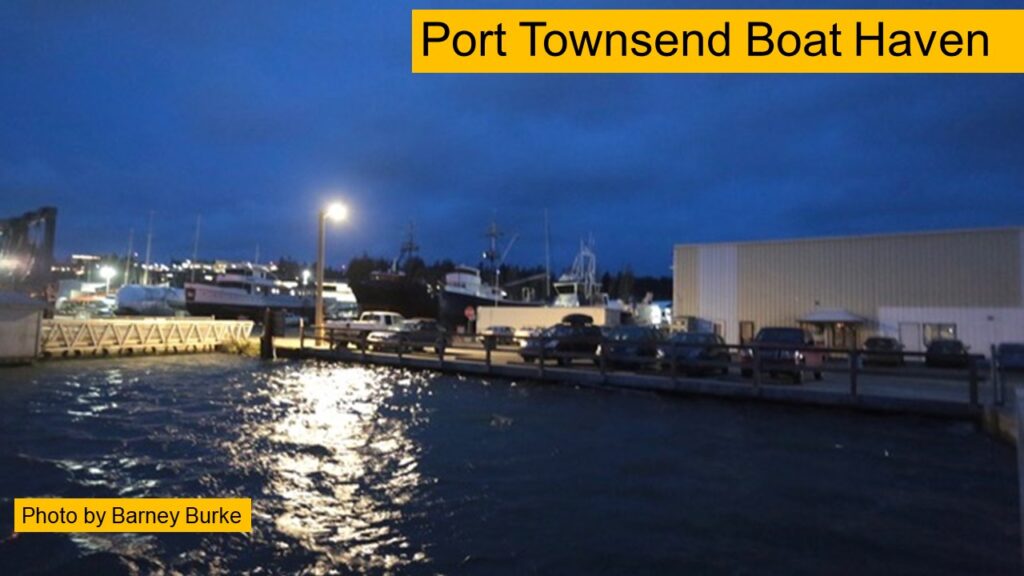
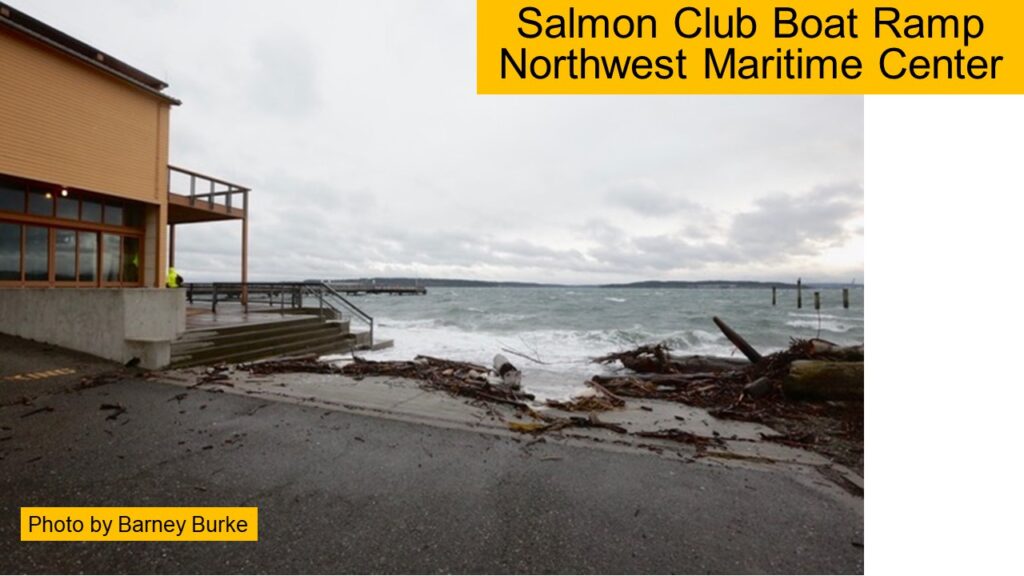
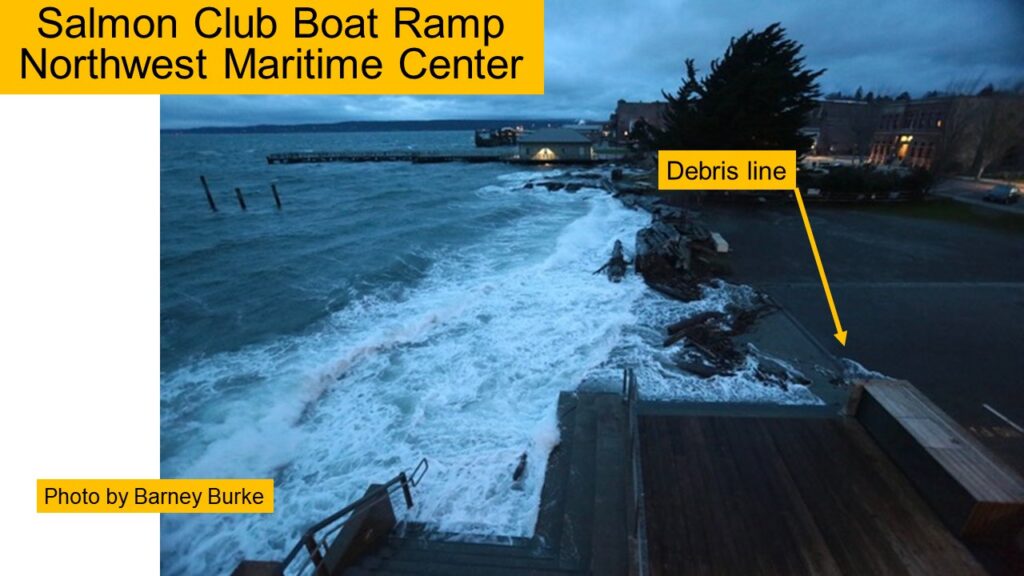
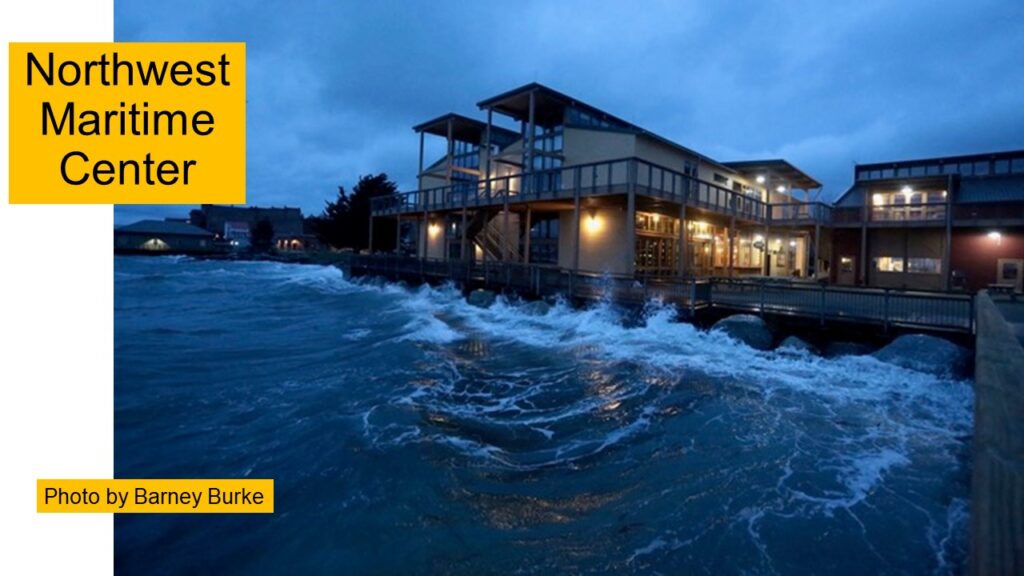
Below is Dave Wilkinson’s summary of the January 6th, 2026 tide, featuring photos from Barney Burke. At the very end you can find links to the tools used.
If you are interested in exploring some of the tools used in the slides above here are some links:
- Astronomical Tides: https://tidesandcurrents.noaa.gov/map/index.html, and then select the area of interest.
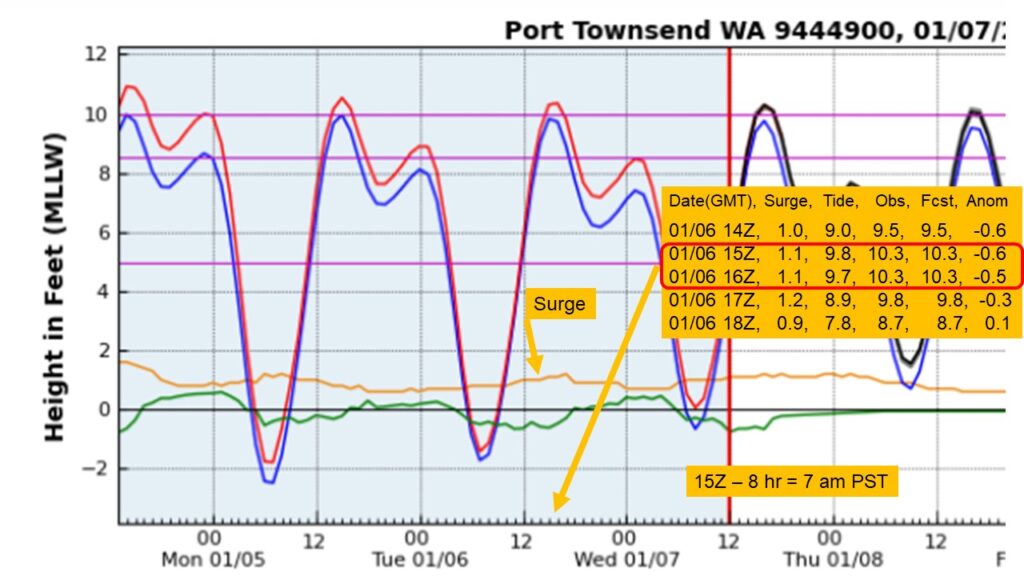
- Storm Surge Prediction Tool that looks out ~3 days: https://slosh.nws.noaa.gov/etsurge/index.php?page=stn®ion=wc&datum=mhhw&list=&map=0-48&type=both&stn=watown
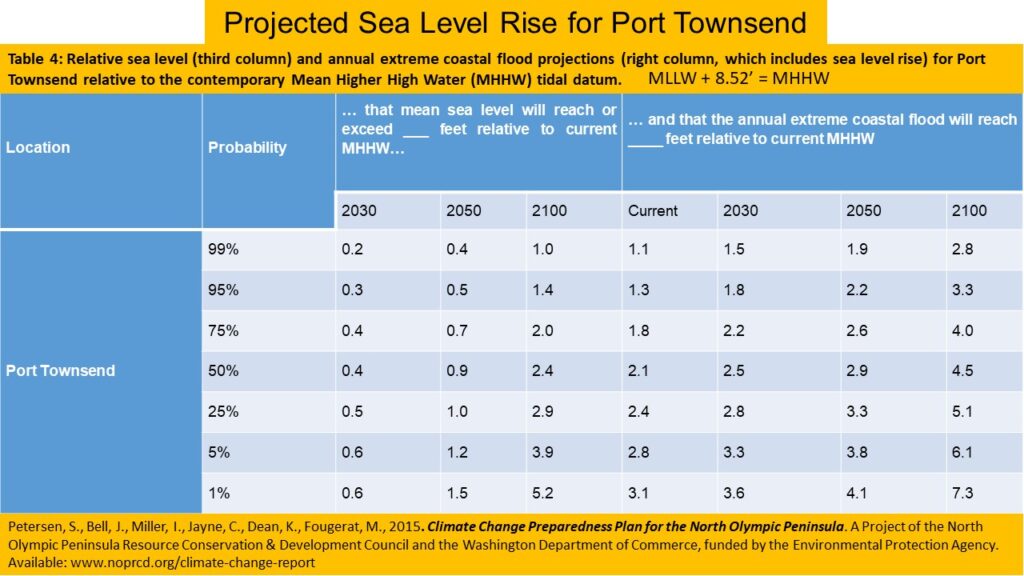
- The NOAA Sea Level Rise Coastal Viewer that has some rough information on coastal elevations across the country. It visually shows what areas are inundated at various levels of sea level rise above Mean High Higher Water (MHHW). Here it is for Port Townsend and 3′ of SLR, referenced to MHHW (which is 8.5′ for the PT tide gauge). So that gives a sense of what a 11.5′ water level (tide prediction plus surge) on the storm surge tool would look like (which has only been seen twice in the last 50 years, most recently on 12/27/22). (Note that these use only the elevation of a given site, and any physical barriers like sea walls, etc., are not taken into account.)
- You can learn more about this project at this website, which also provides instructions for accessing the database of all king tides monitored by the team.
- If you would like more information, contact the Local 20/20 climate group at CAG@L2020.org.